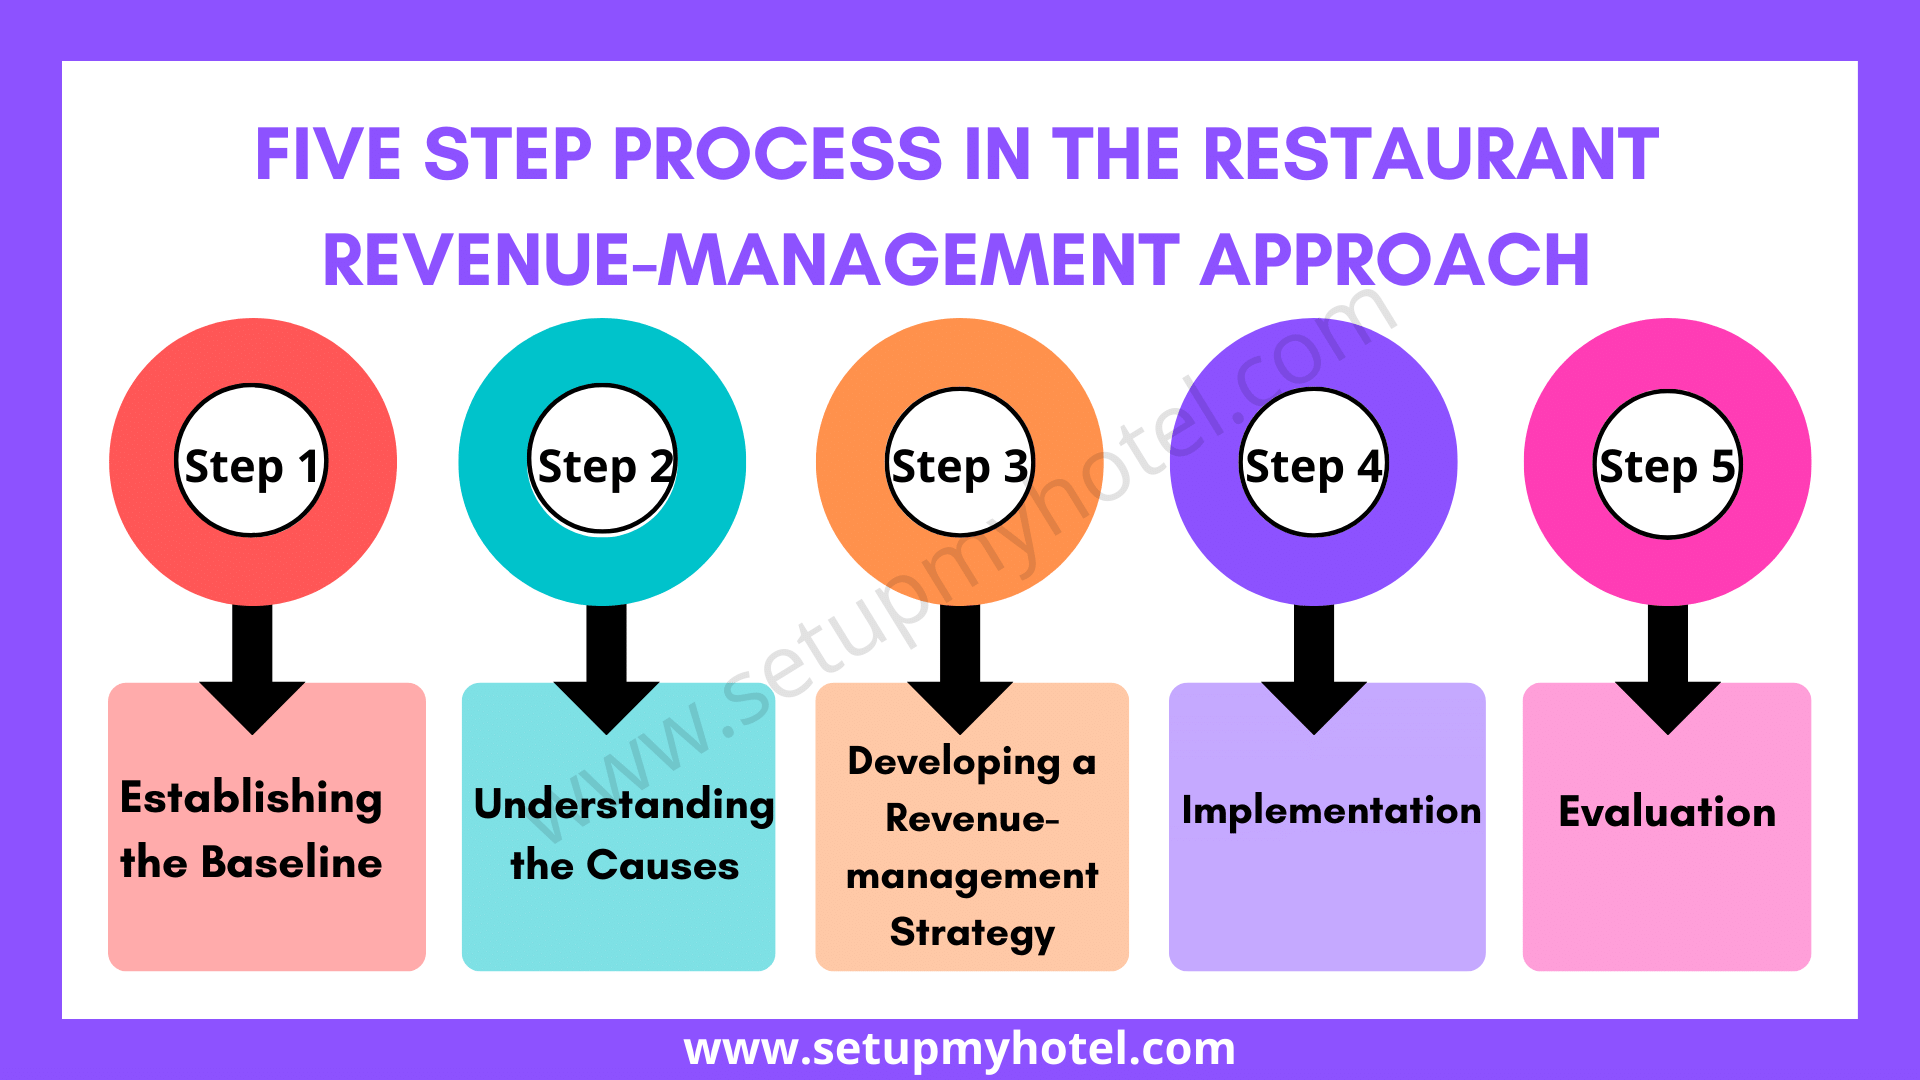
Five-Step Process In Revenue – Management Approach
The five-step process outlined above was used to develop a revenue management strategy for your Restaurant or F&B Service Establishment.
Step 1: Establishing the Baseline
Two four-week periods of POSPoint-of-Sale (POS) Terminal: A cash register with the capability to scan a UPC code with a laser an... data and detailed time studies were used to develop the baseline for the Downtown Restaurant. The average check, the revenue per available seat-hour (RevPASH), the seat occupancy, the meal duration (both from the POS data and from the time studies), and the party-size mix were analyzed, as follows.
- Average checkAverage check is sales revenue divided by number of people served during a certain period of time. S....
- RevPASH.
- Duration.
- Seat occupancy.
- Time-study data
- Examining the dining experience.
- Party composition
Step 2: Understanding the Causes
The baseline analysis led to several questions:
- Why was seat occupancy so low even though customers were waiting for tables?
- Why was the meal itself taking so long?
- Why was there so much variation in meal duration?
- Why were certain parts of the meal (mostly at the beginning and end of the meal) taking so long?
The analysis highlighted two areas that were interfering with the flow of service: namely, the table mix and the service delivery process.
Table mix – Even if dining time could be reduced, customer flow would not increase as much as desired because of the table mix. The party-size calculations showed that 55 to 59 percent of the customers were in parties of one or two, but, as I mentioned above, all of the tables were 4-tops or 6-tops.
It was no wonder that seat occupancy struggled to exceed 50 percent at the same time that customers were waiting for tables. What became clear is that all of the tables were occupied, but often had empty seats because of the large number of small parties.
Service delivery – Three major problems were identified with the service delivery process. The high variability in dining time seemed troublesome, as did the delays in completing payment and bussing. Each was analyzed to help determine the possible causes for the delays.
Step 3: Develop a Revenue-management Strategy
The two major goals were to reduce dining duration by five minutes and to increase seat occupancy by 20 percent. An ancillary goal was to reduce the standard deviation of total dining time by 40 percent.
Managers estimated that these changes would increase revenue by 10 percent during the nine busy hours per week. After determining the goals, the managers started their implementation by specifying the busy (hot) and slow (cold)periods by day of week and hour of day.
“Hot” periods were defined as times when customers were waiting to dine, and all other periods were designated as “cold.” The restaurant’s nine hot hours were Friday, 6:00 to 10:00 PM; Saturday, noon till 3:00 and 6:00 to 9:00; and Sunday afternoon from 12:00 to 3:00).
These were the busy hours that were the focus of the revenue management program’s goal of a 10-percent revenue increase. The goal of increased seat occupancy could be achieved by attracting more customers, providing a better table mix so more customers could be accommodated, or reducing the dining duration so more customers could be served.
There was no point in attempting to attract more customers because the restaurant already had more than it could currently serve during its hot periods (by definition). Moreover, since customers could easily defect to another restaurant even after they put their name on the waitlist, attracting more customers made no sense.
Not only that but the restaurant’s existing table mix and dining duration would not allow the restaurant to serve additional customers. Thus, the managers’ focus was on improving the table mix and reducing dining duration.
Of the two strategic levers available to restaurants for revenue management (i.e., duration control and price), the Chevy managers chose to focus on duration or process control. The team concentrated on ways to better manage arrivals, tighten meal duration, and reduce the amount of time between customers.
Step 4: Implementation
Implementation largely revolved around training staff and implementing the new table mix. The management team began the process by giving all staff members a briefing on revenue management, showing them some of the results from the baseline analysis, and splitting them into function-based teams for discussion of possible approaches to resolving observed problems.
This team-building approach served the restaurant well. The staff members bought into the revenue management program, and managers were able to obtain many useful ideas in the ensuing discussions.
Based on the discussion sessions, management decided to increase the emphasis on pre-bussing in training, to reinforce the need for pre-bussing for existing employees, and to improve managerial oversight of this process. In addition, management decided to train all servers on the importance of quickly processing the check and picking up the completed check folders from the table
Step 5: Evaluation
About a month after the restaurant had been operating with the new table mix and revised procedures, its performance was reevaluated. Specifically, updated POS data were collected so that seat occupancy, RevPASH, and meal duration could be recalculated. In addition, a new series of time studies was conducted. Finally, a financial analysis was performed.
Additional POS data were collected to determine the change in seat occupancy. During the pre-test period, seat occupancy during the hot periods averaged 53 percent with a peak occupancy of 58 percent, while during the post-test period, average seat occupancy during the hot periods increased to 62 percent with a peak seat occupancy of 85 percent.
RevPASH showed a similar improvement. The average RevPASH for the hot period during the pre-test period was $6.85. It increased to $7.32 during the post-test period.
Another series of time studies was conducted to analyze the effects of the duration-management strategies that had been adopted. The mean meal time dropped from 46:45 during the pre-test period to 42:57 for the post-test period.
The standard deviation of total meal duration dropped from 24:41 to 17:19. The goal of a five-minute drop in dining duration was not achieved, but the variation was decreased considerably.
Most duration-management strategies focus on the end of the meal.
Conclusion: The researchers concluded that their results suggested that a significant improvement in meal quality has been achieved, and this was due to the use of duration-management strategies. However, it was noted that there were no clear guidelines in place for the selection of a duration-management strategy.